schoolsolarpanels Solar for schools and academy trusts Book a roof survey

Specialist solar panels for schools across the UK

A school roof generates most of its electricity in the weeks the buildings are empty. We say that first because nobody else does, then we measure the gap, and then we arrange the survey, the design, the grid application and the installation through our MCS-certified partner.

UK wide  /  RAAC and asbestos settled first  /  term and holiday load measured

Book a school roof survey
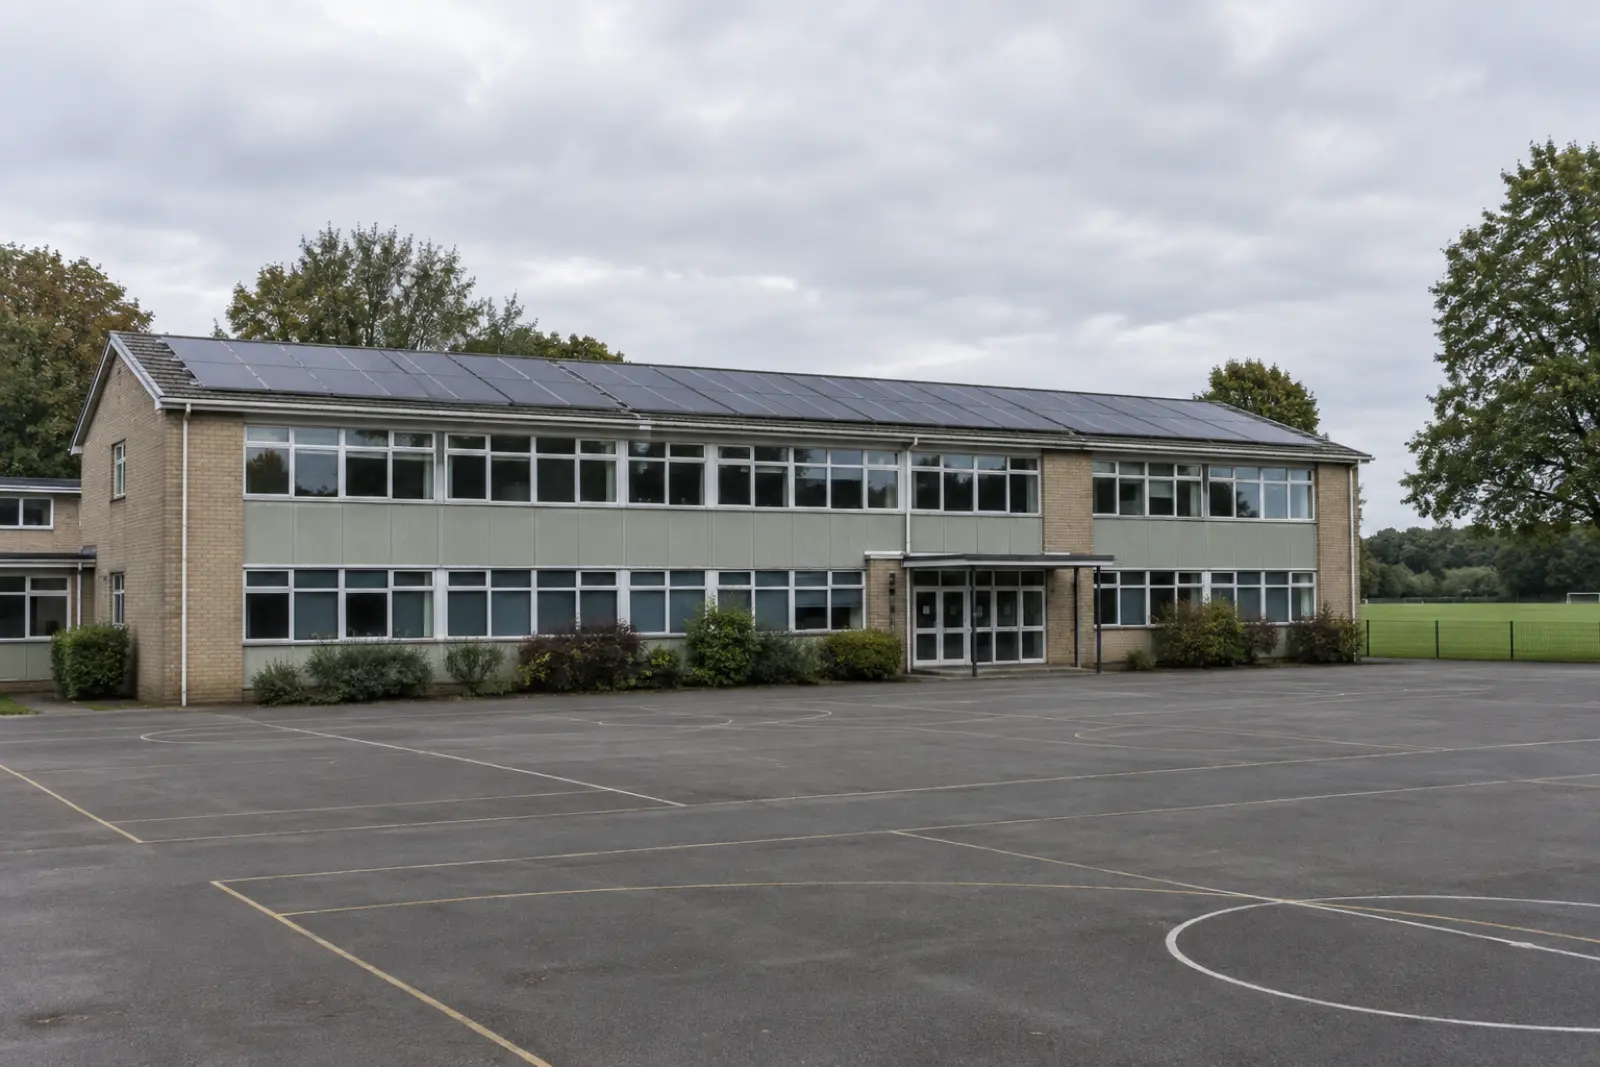
A two storey 1970s school block with a shallow pitched roof covered in solar panels, empty playground in front and a playing field beyond

How school rooftop solar works on an education building

School rooftop solar is a photovoltaic array mounted on an education building that converts daylight into electricity the school consumes before it draws anything from the grid. The solar panels sit on the existing roof, the inverter turns direct current into the alternating current the distribution board already uses, and any electricity the site does not consume is exported under a Smart Export Guarantee tariff, the government backed scheme Ofgem has administered since it launched on 1 January 2020, which obliges larger licensed suppliers to offer a price for units sent back to the grid. Every unit the buildings take from the array is a unit nobody has to buy.

A solar system is not a generator and it does not replace the energy contract. Solar panels cut the volume of electricity a school buys during daylight hours, so the energy bill falls in proportion to what the site consumes on the day rather than to what the roof produces across the year. That distinction does more work on a school than it does anywhere else, and it is the reason the next section exists.

Three things decide whether solar is worth doing on schools and colleges: the roof, the timetable and the grid connection. Most enquiries reach us because energy costs have risen faster than the budget, which is a fair reason to look, and because solar power is now the cheapest generation a site can put on a building it already owns. What we find is that the building and the calendar decide the outcome far more than the panels do, and we say so plainly when the answer is that a site should wait.

RATIO
4.9 m²
of usable roof for every kWp installed
SOURCE
Smart Export Guarantee, Ofgem, launched 1 January 2020
FIG. 1 Where the electricity goes
PANELS the array on your roof DC INVERTER DC becomes AC AC DISTRIBUTION BOARD USED ON SITE displaces your day rate EXPORTED paid at the SEG rate GRID the split is measured from your meter, never assumed
Self-consumption decides the payback, which is why the survey measures half hourly demand against modelled generation before anyone quotes. On a school it decides more than it does anywhere else, for the reason set out below.

Why term dates and school holidays decide what an array is worth

A school's electricity demand collapses in precisely the weeks its roof generates the most, which makes self-consumption on an education building structurally worse than on a warehouse or a factory. This is the single most useful thing we can tell a school about solar, and almost nobody selling it says so.

Roughly half the generation arrives when nobody is in the building. Set the median monthly profile for the 397 towns on this site against a 190 day school year and 49 percent of the output lands while the school is open, 51 percent while it is shut (EU PVGIS v5.2, SARAH3, modelled as described under fig. 2). A business that opens every weekday catches 71 percent of the same roof's output on its working days. The school gives up 22 percentage points purely to school holidays, and that gap is the whole reason this site exists.

It is worth separating the two halves of that loss, because only one of them is a school problem. Weekends take 29 percent of the year's output, and every organisation in the country carries that. The 22 point gap is the school holidays on their own, and it is concentrated rather than spread: July and August between them carry 26 percent of annual output and the buildings are largely empty across both, while December, January and February carry 9 percent and those are the months a school is full, lit and heated. The daily shape compounds it, because the teaching day ends in the middle of the afternoon while the array is still producing strongly.

Four things improve that picture, and a school with two or three of them has a genuinely good case rather than a marginal one. A battery moves generation from the middle of the day into the morning warm up and the after school hours. Holiday letting, a community sports facility or a summer scheme keeps a load under the roof in August. A swimming pool, a commercial kitchen, a data room or mechanical ventilation gives the site a base load that runs whether or not the children are in. And accepting a lower export rate for the holiday surplus, rather than pretending it will be consumed, at least produces a model that survives contact with the meter.

The Department for Education concedes the point in its own words, and it is worth reading closely. Its Education Estates Strategy of 16 February 2026 estimates that on average a typical school could save up to £25,000 a year if it had solar panels with complementary technologies installed such as batteries. The conditional clause at the end of that sentence is the whole argument on this page. The headline figure depends on storage, because without something to shift the generation the school cannot use what it makes.

We measure the split rather than assume it. The survey reads half hourly consumption for the supply across a full twelve months, sets it against modelled generation for the site, and reports what proportion the school would actually use. A scheme sized to the roof will look better on paper and worse on the bill than a scheme sized to the timetable, and the difference is not small. Savings quoted from anything other than that measured share are a modelling assumption wearing the clothes of a forecast.

MODELLED
51%
of a school's annual generation lands on a day the building is shut, against a 190 day school year (EU PVGIS v5.2, and see fig. 2 for the method)
SOURCE
£25,000
a year a typical school could save with solar panels and complementary technologies such as batteries (DfE, Education Estates Strategy, 16 February 2026)
WATCH FOR
A payback quoted from a warehouse model, where the building works all summer
FIG. 2 Generation against the school year
0 35 70 105 140 Jan Feb Mar Apr May Jun Jul Aug Sep Oct Nov Dec kWh August: nobody in the building
  • generated while the school is open
  • generated at a weekend or in the holidays
The same figures as a table
Monthly output for a 1 kWp array in England, split by whether the day is a school session day. Across the year 49 percent of generation lands while the school is open.
Month Session days Output, kWh per kWp School open School closed
Jan 20 24 15 9
Feb 15 38 20 18
Mar 21 73 49 24
Apr 12 104 42 62
May 17 120 66 54
Jun 21 123 86 37
Jul 11 124 44 80
Aug 0 105 0 105
Sep 20 82 55 27
Oct 17 51 28 23
Nov 21 30 21 9
Dec 15 21 10 11
Year 190 895 436 459
Median modelled output across the 397 towns on this site, per kWp installed, split by whether the day is a school session day. Across the year 49 percent lands while the school is open and 51 percent while it is shut. Modelled rather than metered: a month's output is spread evenly across its days and then weighted by session days, on the 190 day year that is the statutory minimum for maintained schools in England. Term dates vary by authority and by trust, and the real split for any one school comes out of its half hourly meter data. Source: EU PVGIS v5.2, SARAH3, against a 190 day English school year

Which buildings on a school site suit an array best

A school building suits solar when it carries a large uninterrupted roof, a load beneath it worth serving, a structure with capacity to spare, and a covering with years of service life left. Most sites hold several buildings put up in different decades, and on a typical estate only one or two are worth an array, which is why the survey looks at the whole site rather than the block somebody happened to ask about.

Area is not the scarce thing here. The Department for Education puts the school estate at around 55 million square metres of roof, with the potential to support an additional estimated 0.8 to 1.9 GW of solar power in its current condition (Education Estates Strategy, 16 February 2026). The constraint has never been how much roof the country's schools own. It is which of those roofs will carry an array, and which of them have a load underneath worth serving.

Age is the variable that separates a school from almost every other commercial roof we look at. A site can carry a Victorian pitched slate block, a 1960s system built teaching wing with a flat roof, a 1990s sports hall and a new build primary in the same grounds, and the four take four different answers. The two findings that matter most both belong to the older buildings. Reinforced autoclaved aerated concrete may be present in the roofs of anything constructed or modified between the 1950s and 1990 (DfE identification guidance, published 14 December 2022 and last updated 20 July 2026), and asbestos containing materials were used extensively in school construction from the 1950s until the material was banned in Great Britain in 1999 (HSE, Asbestos in schools).

Neither finding rules a school or a college out. Both change the order of the work, and both are the reason a school quotation and an industrial quotation for the same kWp look nothing alike. What we will not do is tell a school that a particular roof is safe or unsafe. That is a judgement for a competent structural engineer working to the Institution of Structural Engineers' guidance on RAAC panel investigation and assessment, and our part is to establish which buildings need that assessment before anything is designed on top of them.

WATCH FOR
RAAC planks in a flat roof built between the 1950s and 1990
SOURCE
DfE, Reinforced autoclaved aerated concrete: identification guidance, 14 December 2022, updated 20 July 2026

Sports hall or leisure block

Usually the largest uninterrupted roof on the site and often the best candidate. Evening lettings, weekend club hire and a summer holiday programme give it a load in the hours and weeks the teaching blocks have none, which is worth more here than roof area alone.

Main teaching block

On a site of a certain age this is a flat or shallow roof over a system built frame, and it is the building most likely to fall in the RAAC and asbestos window. Large area, light electrical load, and the one that has to go to a structural engineer before anything else happens.

Swimming pool building

The strongest match on any school estate. Circulation pumps, dehumidification and water heating run through daylight hours all year, and where the pool stays open to the community through August the load holds up in exactly the weeks the rest of the site empties.

Kitchen and dining hall

Refrigeration runs every day of the year including the holidays, and the servery, extract and dishwash draw hard across the middle of the day in term time. A modest roof with a genuinely useful load under it, which is the opposite of most of the estate.

New build primary or nursery

Structurally the most straightforward roof we survey: known construction, known capacity and a covering with its full service life ahead of it. The load beneath it is small and it closes for the whole of August, so the case rests on export value or on a battery rather than on consumption.

Sixth form or college block

A longer day, more IT, more mechanical ventilation and a term calendar that differs from the school one. Colleges also let space more readily outside term, so the self-consumption share on a college block is commonly better than on a secondary school of the same size.

FIG. 3 One site, four blocks, three answers
playing field 4 1 2 3 no array pending structural assessment 0 40 m N
  1. 1 teaching block
  2. 2 hall and kitchen
  3. 3 sports hall
  4. 4 1960s block, no array
  5. first phase
  6. later phase
Drawing Typical secondary estate
Blocks 4, 3 with array
Array about 345 kWp
Yield about 306,000 kWh/yr
Frontage about 90 m / Rev A

Illustrative layout for an estate of this size. The array is drawn at about 345 kWp, roughly 53 percent of the 650 kWp these three roofs would hold, because a school sizes to the load it can use in term time rather than to the roof it has: generation it cannot use is exported at a much lower rate than it pays to import. The hatched block carries no array because its structure has not been assessed, which on a school of that era is the usual starting point rather than an exception. Your own figures, and which of your blocks can take an array, come from the roof survey.

Illustrative of an estate of this size rather than a survey of any school. Three blocks carry an array and one is hatched out, carrying none pending structural assessment, which on an estate of that age is the ordinary starting point rather than a caveat. Source: Array size derived from the modules drawn, at 886 kWh per kWp, the mean modelled yield across the towns we cover (EU PVGIS v5.2, SARAH3)
FIG. 4 Gross roof to usable array
gross roof 2,400 m²
usable 1,620 m²
rooflightsplant and ductswalkways, setbacks usable roof
1,620 m² ÷ 4.9 m² per kWp = 331 kWp
On a school building the deductions are rooflights, plant and ductwork, lift overruns and the setback a safe working edge needs, plus anything that shades the rest. Proportions are illustrative. Yours are measured on the day.

The survey we run before anyone quotes

A school solar survey is a structural, electrical and commercial assessment that establishes what the buildings can physically carry and what the resulting system would be worth against the school's own consumption. It carries no fee, it carries no obligation, and the reports are the school's to keep whoever ends up doing the work.

ITEM
WHAT WE MEASURE
WHY IT DECIDES THE SCHEME
OUTPUT
A
Structure and covering
Deck and covering type, remaining service life, and whether the block falls in the window where reinforced autoclaved aerated concrete or asbestos containing materials may be present. Where it does, the structural question goes to a chartered engineer before an array is drawn on it.
loading position
B
Usable roof area
Rooflights, plant, ductwork, lift overruns and the setback a safe working edge needs come out of the gross area first, along with anything that shades it. What is left sets the array size in kWp, which is the only figure worth quoting against.
array layout, kWp
C
Term and holiday load
Half hourly consumption across a full twelve months, read term by term rather than as an annual total, and set against modelled generation. This is where the summer gap becomes a number instead of a worry, and it is the figure any saving must be calculated from.
self-consumption share
D
The connection
The distribution network operator for the area, whether the supply is single or three phase, the headroom on the board, the export limit worth applying for and whether the connection runs under G98 or G99.
G99 application

The age of the estate sets the order. Where a block falls in the RAAC or asbestos window, the structural and asbestos position is settled before an array layout is drawn rather than after, because a design resting on an assumption about a 1970s roof is not a design. Where a covering is near the end of its life, re-roofing first is normally cheaper than lifting an array off in five years to do it then.

We also ask what the estate plan says. A block scheduled for replacement, a new teaching wing, a kitchen refit, a move to a heat pump or a planned change in how the site is let through the holidays all shift the load an array is being sized against. A system meant to last two decades should be sized against the electricity the school will use in ten years rather than the electricity it used last year, and on a school the holiday letting question changes the answer more than anything else on that list.

886
kWh per kWp a year, the mean across the towns we cover
51%
of a school's generation arrives on a day the building is shut
74
school, college and academy solar schemes recorded across those towns
48
counties we arrange school roof surveys in
Yield and monthly shape modelled with EU PVGIS v5.2, SARAH3. Scheme counts from the Renewable Energy Planning Database, Q1 2026, filtered on school, college and academy operators and site names.

How much electricity a school roof generates in a year

Annual generation is the product of the system size in kWp and the yield for the location, expressed in kWh of electricity for every kWp installed. Across the towns on this site, modelled yield runs from 704 to 1,028 kWh per kWp a year (EU PVGIS v5.2, SARAH3), and every location page carries the figure for that area alongside its source, so a roof in Cornwall and one in Aberdeenshire are not quietly treated as the same number.

Value follows consumption rather than generation. Electricity used on site displaces the day rate the school would otherwise pay, which is the highest value outcome available. Electricity exported earns the Smart Export Guarantee rate from the chosen supplier (Ofgem), which is materially lower. On most commercial buildings that split is a detail. On an education building it is the whole question, because the calendar pushes so much of the generation into weeks when nobody is there to use it.

The monthly shape is what a school should look at, not the annual total. The brightest month produces roughly six times what the dullest one does across our towns, and the annual figure hides exactly the thing that decides the return. We model twelve months of generation against twelve months of half hourly consumption for the same site, and the resulting self-consumption share is the number worth arguing about.

SOURCE
EU PVGIS v5.2, SARAH3, 10 degree pitch, 14 percent system loss
FIG. 5 Modelled yield across the towns we cover

Modelled yield across the towns we cover

One dot per town, positioned at its centroid and shaded by modelled annual yield in kWh per kWp. Source: EU PVGIS v5.2.

Bedford, Bedfordshire: 900 kWh per kWp Biggleswade, Bedfordshire: 902 kWh per kWp Dunstable, Bedfordshire: 893 kWh per kWp Flitwick, Bedfordshire: 899 kWh per kWp Leighton Buzzard, Bedfordshire: 892 kWh per kWp Luton, Bedfordshire: 899 kWh per kWp Sandy, Bedfordshire: 902 kWh per kWp Bracknell, Berkshire: 891 kWh per kWp Maidenhead, Berkshire: 905 kWh per kWp Newbury, Berkshire: 904 kWh per kWp Reading, Berkshire: 907 kWh per kWp Slough, Berkshire: 903 kWh per kWp Thatcham, Berkshire: 910 kWh per kWp Windsor, Berkshire: 901 kWh per kWp Wokingham, Berkshire: 898 kWh per kWp Bedminster, Bristol: 906 kWh per kWp Bishopston, Bristol: 908 kWh per kWp Filton, Bristol: 895 kWh per kWp Hengrove, Bristol: 903 kWh per kWp Keynsham, Bristol: 902 kWh per kWp Amersham, Buckinghamshire: 890 kWh per kWp Aylesbury, Buckinghamshire: 881 kWh per kWp Beaconsfield, Buckinghamshire: 892 kWh per kWp Buckingham, Buckinghamshire: 893 kWh per kWp Chesham, Buckinghamshire: 891 kWh per kWp High Wycombe, Buckinghamshire: 892 kWh per kWp Marlow, Buckinghamshire: 904 kWh per kWp Princes Risborough, Buckinghamshire: 883 kWh per kWp Cambridge, Cambridgeshire: 906 kWh per kWp Ely, Cambridgeshire: 904 kWh per kWp Huntingdon, Cambridgeshire: 908 kWh per kWp March, Cambridgeshire: 900 kWh per kWp Peterborough, Cambridgeshire: 898 kWh per kWp St Ives, Cambridgeshire: 906 kWh per kWp St Neots, Cambridgeshire: 898 kWh per kWp Wisbech, Cambridgeshire: 905 kWh per kWp Canton, Cardiff: 936 kWh per kWp Cathays, Cardiff: 908 kWh per kWp Pontcanna, Cardiff: 936 kWh per kWp Splott, Cardiff: 908 kWh per kWp Chester, Cheshire: 836 kWh per kWp Crewe, Cheshire: 835 kWh per kWp Ellesmere Port, Cheshire: 835 kWh per kWp Macclesfield, Cheshire: 790 kWh per kWp Nantwich, Cheshire: 840 kWh per kWp Northwich, Cheshire: 832 kWh per kWp Warrington, Cheshire: 828 kWh per kWp Wilmslow, Cheshire: 801 kWh per kWp Bodmin, Cornwall: 929 kWh per kWp Bude, Cornwall: 929 kWh per kWp Camborne, Cornwall: 921 kWh per kWp Falmouth, Cornwall: 943 kWh per kWp Newquay, Cornwall: 940 kWh per kWp Penzance, Cornwall: 979 kWh per kWp St Austell, Cornwall: 936 kWh per kWp Truro, Cornwall: 940 kWh per kWp Bishop Auckland, County Durham: 817 kWh per kWp Chester-le-Street, County Durham: 821 kWh per kWp Consett, County Durham: 811 kWh per kWp Durham, County Durham: 823 kWh per kWp Newton Aycliffe, County Durham: 819 kWh per kWp Peterlee, County Durham: 845 kWh per kWp Barrow-in-Furness, Cumbria: 893 kWh per kWp Carlisle, Cumbria: 806 kWh per kWp Kendal, Cumbria: 793 kWh per kWp Penrith, Cumbria: 794 kWh per kWp Whitehaven, Cumbria: 855 kWh per kWp Workington, Cumbria: 835 kWh per kWp Belper, Derbyshire: 850 kWh per kWp Buxton, Derbyshire: 805 kWh per kWp Chesterfield, Derbyshire: 843 kWh per kWp Derby, Derbyshire: 862 kWh per kWp Ilkeston, Derbyshire: 855 kWh per kWp Long Eaton, Derbyshire: 866 kWh per kWp Matlock, Derbyshire: 844 kWh per kWp Swadlincote, Derbyshire: 856 kWh per kWp Barnstaple, Devon: 908 kWh per kWp Exeter, Devon: 938 kWh per kWp Exmouth, Devon: 937 kWh per kWp Newton Abbot, Devon: 943 kWh per kWp Paignton, Devon: 961 kWh per kWp Plymouth, Devon: 960 kWh per kWp Tiverton, Devon: 903 kWh per kWp Torquay, Devon: 937 kWh per kWp Bournemouth, Dorset: 971 kWh per kWp Bridport, Dorset: 971 kWh per kWp Christchurch, Dorset: 981 kWh per kWp Dorchester, Dorset: 985 kWh per kWp Poole, Dorset: 965 kWh per kWp Sherborne, Dorset: 924 kWh per kWp Weymouth, Dorset: 1006 kWh per kWp Wimborne, Dorset: 964 kWh per kWp Beverley, East Riding of Yorkshire: 864 kWh per kWp Bridlington, East Riding of Yorkshire: 859 kWh per kWp Driffield, East Riding of Yorkshire: 870 kWh per kWp Goole, East Riding of Yorkshire: 858 kWh per kWp Hessle, East Riding of Yorkshire: 868 kWh per kWp Hull, East Riding of Yorkshire: 867 kWh per kWp Basildon, Essex: 933 kWh per kWp Braintree, Essex: 932 kWh per kWp Brentwood, Essex: 913 kWh per kWp Canvey Island, Essex: 945 kWh per kWp Chelmsford, Essex: 930 kWh per kWp Clacton-on-Sea, Essex: 973 kWh per kWp Colchester, Essex: 953 kWh per kWp Grays, Essex: 927 kWh per kWp Harlow, Essex: 908 kWh per kWp Southend-on-Sea, Essex: 942 kWh per kWp Cheltenham, Gloucestershire: 879 kWh per kWp Cirencester, Gloucestershire: 892 kWh per kWp Gloucester, Gloucestershire: 870 kWh per kWp Lydney, Gloucestershire: 905 kWh per kWp Stroud, Gloucestershire: 887 kWh per kWp Tewkesbury, Gloucestershire: 878 kWh per kWp Barking, Greater London: 909 kWh per kWp Barnet, Greater London: 899 kWh per kWp Battersea, Greater London: 908 kWh per kWp Bermondsey, Greater London: 907 kWh per kWp Bexley, Greater London: 916 kWh per kWp Brixton, Greater London: 906 kWh per kWp Bromley, Greater London: 908 kWh per kWp Camden, Greater London: 902 kWh per kWp Chelsea, Greater London: 908 kWh per kWp City of London, Greater London: 903 kWh per kWp Clapham, Greater London: 906 kWh per kWp Croydon, Greater London: 895 kWh per kWp Ealing, Greater London: 905 kWh per kWp Enfield, Greater London: 898 kWh per kWp Fulham, Greater London: 910 kWh per kWp Hackney, Greater London: 903 kWh per kWp Hammersmith, Greater London: 910 kWh per kWp Hampstead, Greater London: 900 kWh per kWp Harrow, Greater London: 902 kWh per kWp Havering, Greater London: 908 kWh per kWp Highgate, Greater London: 900 kWh per kWp Hillingdon, Greater London: 904 kWh per kWp Hounslow, Greater London: 910 kWh per kWp Ilford, Greater London: 909 kWh per kWp Islington, Greater London: 902 kWh per kWp Kensington, Greater London: 903 kWh per kWp Kentish Town, Greater London: 900 kWh per kWp Kingston, Greater London: 987 kWh per kWp Lewisham, Greater London: 904 kWh per kWp Leytonstone, Greater London: 903 kWh per kWp Marylebone, Greater London: 902 kWh per kWp Mayfair, Greater London: 902 kWh per kWp Merton, Greater London: 902 kWh per kWp Notting Hill, Greater London: 906 kWh per kWp Redbridge, Greater London: 903 kWh per kWp Richmond, Greater London: 910 kWh per kWp Shoreditch, Greater London: 903 kWh per kWp Southwark, Greater London: 903 kWh per kWp Stratford, Greater London: 904 kWh per kWp Sutton, Greater London: 847 kWh per kWp Tottenham, Greater London: 902 kWh per kWp Tower Hamlets, Greater London: 976 kWh per kWp Vauxhall, Greater London: 906 kWh per kWp Walthamstow, Greater London: 898 kWh per kWp Wandsworth, Greater London: 908 kWh per kWp Wembley, Greater London: 901 kWh per kWp Westminster, Greater London: 902 kWh per kWp Whitechapel, Greater London: 903 kWh per kWp Wimbledon, Greater London: 904 kWh per kWp Woolwich, Greater London: 912 kWh per kWp Altrincham, Greater Manchester: 816 kWh per kWp Ashton-under-Lyne, Greater Manchester: 769 kWh per kWp Bolton, Greater Manchester: 801 kWh per kWp Bury, Greater Manchester: 788 kWh per kWp Manchester, Greater Manchester: 788 kWh per kWp Oldham, Greater Manchester: 771 kWh per kWp Rochdale, Greater Manchester: 771 kWh per kWp Salford, Greater Manchester: 794 kWh per kWp Stockport, Greater Manchester: 785 kWh per kWp Wigan, Greater Manchester: 828 kWh per kWp Bangor, Gwynedd: 733 kWh per kWp Bethesda, Gwynedd: 704 kWh per kWp Caernarfon, Gwynedd: 798 kWh per kWp Dolgellau, Gwynedd: 746 kWh per kWp Porthmadog, Gwynedd: 820 kWh per kWp Pwllheli, Gwynedd: 887 kWh per kWp Aldershot, Hampshire: 903 kWh per kWp Andover, Hampshire: 915 kWh per kWp Basingstoke, Hampshire: 906 kWh per kWp Eastleigh, Hampshire: 942 kWh per kWp Fareham, Hampshire: 980 kWh per kWp Farnborough, Hampshire: 903 kWh per kWp Fleet, Hampshire: 904 kWh per kWp Portsmouth, Hampshire: 987 kWh per kWp Southampton, Hampshire: 950 kWh per kWp Winchester, Hampshire: 917 kWh per kWp Bishop's Stortford, Hertfordshire: 911 kWh per kWp Borehamwood, Hertfordshire: 895 kWh per kWp Harpenden, Hertfordshire: 896 kWh per kWp Hatfield, Hertfordshire: 901 kWh per kWp Hemel Hempstead, Hertfordshire: 895 kWh per kWp Hertford, Hertfordshire: 901 kWh per kWp St Albans, Hertfordshire: 901 kWh per kWp Stevenage, Hertfordshire: 901 kWh per kWp Watford, Hertfordshire: 898 kWh per kWp Welwyn Garden City, Hertfordshire: 899 kWh per kWp Ashford, Kent: 983 kWh per kWp Canterbury, Kent: 961 kWh per kWp Chatham, Kent: 920 kWh per kWp Dartford, Kent: 915 kWh per kWp Dover, Kent: 972 kWh per kWp Folkestone, Kent: 990 kWh per kWp Gravesend, Kent: 926 kWh per kWp Maidstone, Kent: 930 kWh per kWp Margate, Kent: 990 kWh per kWp Sevenoaks, Kent: 920 kWh per kWp Tonbridge, Kent: 927 kWh per kWp Tunbridge Wells, Kent: 930 kWh per kWp Accrington, Lancashire: 783 kWh per kWp Blackburn, Lancashire: 782 kWh per kWp Blackpool, Lancashire: 888 kWh per kWp Burnley, Lancashire: 774 kWh per kWp Chorley, Lancashire: 787 kWh per kWp Lancaster, Lancashire: 797 kWh per kWp Lytham St Anne's, Lancashire: 878 kWh per kWp Preston, Lancashire: 805 kWh per kWp Coalville, Leicestershire: 863 kWh per kWp Hinckley, Leicestershire: 870 kWh per kWp Leicester, Leicestershire: 874 kWh per kWp Loughborough, Leicestershire: 868 kWh per kWp Market Harborough, Leicestershire: 891 kWh per kWp Melton Mowbray, Leicestershire: 879 kWh per kWp Wigston, Leicestershire: 877 kWh per kWp Boston, Lincolnshire: 906 kWh per kWp Gainsborough, Lincolnshire: 861 kWh per kWp Grantham, Lincolnshire: 886 kWh per kWp Lincoln, Lincolnshire: 882 kWh per kWp Skegness, Lincolnshire: 894 kWh per kWp Sleaford, Lincolnshire: 898 kWh per kWp Spalding, Lincolnshire: 902 kWh per kWp Stamford, Lincolnshire: 896 kWh per kWp Birkenhead, Merseyside: 855 kWh per kWp Bootle, Merseyside: 853 kWh per kWp Liverpool, Merseyside: 848 kWh per kWp Southport, Merseyside: 877 kWh per kWp St Helens, Merseyside: 830 kWh per kWp Wallasey, Merseyside: 862 kWh per kWp Caerleon, Newport: 905 kWh per kWp Cwmbrân, Newport: 903 kWh per kWp Maindee, Newport: 910 kWh per kWp Pontypool, Newport: 887 kWh per kWp Attleborough, Norfolk: 906 kWh per kWp Cromer, Norfolk: 923 kWh per kWp Dereham, Norfolk: 898 kWh per kWp Great Yarmouth, Norfolk: 920 kWh per kWp King's Lynn, Norfolk: 897 kWh per kWp Norwich, Norfolk: 904 kWh per kWp Thetford, Norfolk: 897 kWh per kWp Wymondham, Norfolk: 906 kWh per kWp Harrogate, North Yorkshire: 831 kWh per kWp Knaresborough, North Yorkshire: 833 kWh per kWp Northallerton, North Yorkshire: 817 kWh per kWp Ripon, North Yorkshire: 834 kWh per kWp Scarborough, North Yorkshire: 859 kWh per kWp Skipton, North Yorkshire: 799 kWh per kWp Whitby, North Yorkshire: 849 kWh per kWp York, North Yorkshire: 840 kWh per kWp Corby, Northamptonshire: 892 kWh per kWp Daventry, Northamptonshire: 890 kWh per kWp Kettering, Northamptonshire: 895 kWh per kWp Northampton, Northamptonshire: 893 kWh per kWp Rushden, Northamptonshire: 900 kWh per kWp Towcester, Northamptonshire: 897 kWh per kWp Wellingborough, Northamptonshire: 896 kWh per kWp Alnwick, Northumberland: 840 kWh per kWp Berwick-upon-Tweed, Northumberland: 827 kWh per kWp Blyth, Northumberland: 848 kWh per kWp Cramlington, Northumberland: 825 kWh per kWp Hexham, Northumberland: 803 kWh per kWp Morpeth, Northumberland: 824 kWh per kWp Arnold, Nottinghamshire: 857 kWh per kWp Mansfield, Nottinghamshire: 852 kWh per kWp Newark, Nottinghamshire: 874 kWh per kWp Nottingham, Nottinghamshire: 859 kWh per kWp Retford, Nottinghamshire: 869 kWh per kWp West Bridgford, Nottinghamshire: 864 kWh per kWp Worksop, Nottinghamshire: 842 kWh per kWp Abingdon, Oxfordshire: 904 kWh per kWp Banbury, Oxfordshire: 891 kWh per kWp Bicester, Oxfordshire: 895 kWh per kWp Didcot, Oxfordshire: 913 kWh per kWp Henley-on-Thames, Oxfordshire: 899 kWh per kWp Oxford, Oxfordshire: 895 kWh per kWp Thame, Oxfordshire: 891 kWh per kWp Witney, Oxfordshire: 902 kWh per kWp Brecon, Powys: 828 kWh per kWp Builth Wells, Powys: 830 kWh per kWp Hay on Wye, Powys: 838 kWh per kWp Llandrindod Wells, Powys: 825 kWh per kWp Newtown, Powys: 820 kWh per kWp Welshpool, Powys: 831 kWh per kWp Bridgnorth, Shropshire: 856 kWh per kWp Ludlow, Shropshire: 860 kWh per kWp Market Drayton, Shropshire: 842 kWh per kWp Oswestry, Shropshire: 855 kWh per kWp Shrewsbury, Shropshire: 852 kWh per kWp Bath, Somerset: 904 kWh per kWp Bridgwater, Somerset: 931 kWh per kWp Frome, Somerset: 894 kWh per kWp Glastonbury, Somerset: 913 kWh per kWp Taunton, Somerset: 911 kWh per kWp Wells, Somerset: 899 kWh per kWp Weston-super-Mare, Somerset: 934 kWh per kWp Yeovil, Somerset: 923 kWh per kWp Barnsley, South Yorkshire: 839 kWh per kWp Doncaster, South Yorkshire: 856 kWh per kWp Mexborough, South Yorkshire: 847 kWh per kWp Rotherham, South Yorkshire: 835 kWh per kWp Sheffield, South Yorkshire: 830 kWh per kWp Wombwell, South Yorkshire: 838 kWh per kWp Burton upon Trent, Staffordshire: 852 kWh per kWp Cannock, Staffordshire: 842 kWh per kWp Lichfield, Staffordshire: 857 kWh per kWp Newcastle-under-Lyme, Staffordshire: 826 kWh per kWp Stafford, Staffordshire: 842 kWh per kWp Stoke-on-Trent, Staffordshire: 833 kWh per kWp Tamworth, Staffordshire: 857 kWh per kWp Bury St Edmunds, Suffolk: 912 kWh per kWp Felixstowe, Suffolk: 950 kWh per kWp Ipswich, Suffolk: 933 kWh per kWp Leiston, Suffolk: 956 kWh per kWp Lowestoft, Suffolk: 938 kWh per kWp Newmarket, Suffolk: 905 kWh per kWp Stowmarket, Suffolk: 922 kWh per kWp Sudbury, Suffolk: 923 kWh per kWp Camberley, Surrey: 900 kWh per kWp Dorking, Surrey: 916 kWh per kWp Epsom, Surrey: 900 kWh per kWp Farnham, Surrey: 903 kWh per kWp Guildford, Surrey: 908 kWh per kWp Leatherhead, Surrey: 910 kWh per kWp Redhill, Surrey: 916 kWh per kWp Staines, Surrey: 903 kWh per kWp Weybridge, Surrey: 905 kWh per kWp Woking, Surrey: 905 kWh per kWp Bognor Regis, Sussex: 1000 kWh per kWp Brighton, Sussex: 1015 kWh per kWp Chichester, Sussex: 1028 kWh per kWp Crawley, Sussex: 915 kWh per kWp Eastbourne, Sussex: 1017 kWh per kWp Hastings, Sussex: 989 kWh per kWp Haywards Heath, Sussex: 957 kWh per kWp Horsham, Sussex: 935 kWh per kWp Lewes, Sussex: 1028 kWh per kWp Worthing, Sussex: 999 kWh per kWp Morriston, Swansea: 899 kWh per kWp Mumbles, Swansea: 921 kWh per kWp Neath, Swansea: 881 kWh per kWp Sketty, Swansea: 921 kWh per kWp Gateshead, Tyne and Wear: 822 kWh per kWp Newcastle, Tyne and Wear: 806 kWh per kWp North Shields, Tyne and Wear: 833 kWh per kWp South Shields, Tyne and Wear: 849 kWh per kWp Sunderland, Tyne and Wear: 849 kWh per kWp Washington, Tyne and Wear: 828 kWh per kWp Bedworth, Warwickshire: 866 kWh per kWp Kenilworth, Warwickshire: 877 kWh per kWp Leamington Spa, Warwickshire: 880 kWh per kWp Nuneaton, Warwickshire: 866 kWh per kWp Rugby, Warwickshire: 882 kWh per kWp Stratford-upon-Avon, Warwickshire: 893 kWh per kWp Warwick, Warwickshire: 880 kWh per kWp Birmingham, West Midlands: 854 kWh per kWp Coventry, West Midlands: 868 kWh per kWp Dudley, West Midlands: 845 kWh per kWp Solihull, West Midlands: 860 kWh per kWp Sutton Coldfield, West Midlands: 852 kWh per kWp Walsall, West Midlands: 851 kWh per kWp West Bromwich, West Midlands: 852 kWh per kWp Wolverhampton, West Midlands: 839 kWh per kWp Bradford, West Yorkshire: 817 kWh per kWp Dewsbury, West Yorkshire: 835 kWh per kWp Halifax, West Yorkshire: 812 kWh per kWp Huddersfield, West Yorkshire: 811 kWh per kWp Ilkley, West Yorkshire: 813 kWh per kWp Leeds, West Yorkshire: 830 kWh per kWp Pontefract, West Yorkshire: 846 kWh per kWp Wakefield, West Yorkshire: 837 kWh per kWp Chippenham, Wiltshire: 894 kWh per kWp Devizes, Wiltshire: 906 kWh per kWp Marlborough, Wiltshire: 900 kWh per kWp Melksham, Wiltshire: 912 kWh per kWp Salisbury, Wiltshire: 923 kWh per kWp Swindon, Wiltshire: 899 kWh per kWp Trowbridge, Wiltshire: 909 kWh per kWp Warminster, Wiltshire: 912 kWh per kWp Bromsgrove, Worcestershire: 872 kWh per kWp Droitwich, Worcestershire: 877 kWh per kWp Evesham, Worcestershire: 876 kWh per kWp Kidderminster, Worcestershire: 866 kWh per kWp Malvern, Worcestershire: 875 kWh per kWp Redditch, Worcestershire: 877 kWh per kWp Worcester, Worcestershire: 882 kWh per kWp
kWh per kWp a year
  • 704
  • 758
  • 812
  • 866
  • 920
  • 974

The spread between the best and worst town on this map is 324 kWh per kWp, which is about 46 percent. On a 500 kWp array that is roughly 162,000 kWh a year of difference for the same money spent.

Source: EU PVGIS v5.2

Can schools get free solar panels?

Free solar panels for schools normally means one of three arrangements, and only one of them is genuinely free at the point of use. The phrase does a lot of work in this market and it is worth taking apart before a governing body signs anything.

The first is a grant, where public money pays for the equipment and the school keeps the electricity. The Great British Energy Solar Partnership is the live example. As at 16 July 2026, 245 schools and colleges already had government funded solar panels, a further 100 were announced as joining, backed by up to £40 million, and 150 schools and colleges across Yorkshire and the Humber, the East Midlands and the South East were to pilot a different model, with the private sector installing and maintaining the panels at no upfront cost (gov.uk). The Partnership is an investment of up to £255 million in total across schools, colleges, NHS sites and military facilities. Where a school is in it, the panels genuinely are free to that school.

Now the part that almost nothing else written on this subject will tell you, and for most readers it is the most useful sentence on the page. There is no application. The published government material describes schools being selected and targeted, primarily clustered in areas of deprivation in the North East, the West Midlands and the North West, with at least ten schools in each region of England. No government page publishes an application form, an application portal or a closing date, because the allocation is made centrally and the school is contacted. So if a supplier hands a business manager an application guide for the current round, the question to ask is which gov.uk page it came from. We have looked and we cannot find one. A school cannot apply its way onto the Great British Energy programme, and a proposal whose funding case rests on doing so is not a funding case.

The 150 school pilot is worth watching for a different reason. A model where the private sector installs and maintains the panels at no upfront cost is, in substance, the second arrangement below wearing a government badge, and it should be read with the same care as any other contract of that shape.

The second is a power purchase agreement, which is the offer most schools mean when they say free solar. A third party funds and owns the array, installs it at no capital cost, and sells the school the electricity it generates under a contract that commonly runs fifteen to twenty five years. Nothing is paid up front, which is the attraction. What is given up is the cheapest electricity on the site for the length of the term, plus whatever the contract says about roof access, about who repairs the covering underneath, and about what happens on a lease assignment or an academy conversion. A PPA can be a sound answer for a school with no capital and a strong load. It is not free, and it should be read by whoever reads the school's other long contracts.

The third is a community energy scheme, where a local society raises the capital, owns the array and shares the benefit with the site. Community energy has put solar on a good number of British schools and colleges, and the terms are usually more generous than a commercial PPA, but they depend on a local organisation existing and on a share offer succeeding, so they are an opportunity rather than a plan. Our funding page sets the three routes out against each other, with the published position on each.

SOURCE
245
schools and colleges with government funded solar, plus 100 more backed by up to £40 million (gov.uk, 16 July 2026)
WATCH FOR
An application guide for a programme that has no application route
WATCH FOR
A free offer that is a twenty year contract for the electricity

Funding solar PV for academy trusts and maintained schools

The funding route a school can use is set by what kind of school it is, because an academy trust, a maintained school and a further education college each sit under a different capital regime. Getting that wrong wastes a term, and it is the most common reason a promising scheme never reaches a quotation. Great British Energy installations aside, which are allocated rather than applied for, almost everything below is capital the school or its authority already controls.

An academy trust holds its own capital and its own balance sheet. Devolved formula capital accumulates across the trust, the Condition Improvement Fund runs as a competitive bidding round for smaller trusts, standalone academies and sixth form colleges, and larger trusts receive a school condition allocation to spend against their own estate priorities. A trust that can pool several years of devolved formula capital across a number of schools is in a materially stronger position than a single primary school trying to fund an array from one year of it, and pooling is the single change that most often moves a trust scheme from marginal to worth doing.

A maintained school sits inside its local authority's capital programme, and the authority is the body that holds the funding and, in most cases, the freehold. That makes the local authority a necessary party rather than an interested one. Some authorities have run their own solar programmes across the schools they maintain, which is usually a better route than a single school going alone, and it is worth asking the question before anything else.

Across both, the public sector decarbonisation route has funded heat and energy efficiency work on the school estate in phases rather than continuously, and government has run its clean energy support for schools and colleges in announced programmes rather than as an open door. We treat none of those as an available route until we can point at a current, open, published one, and at the time of writing we are not pointing at any. We do not state grant amounts we cannot source, we do not present a closed or centrally allocated programme as something a school can bid into, and we will tell a school plainly when the honest answer is that no scheme is open to it this year. That answer is more common than the market admits.

One structural point is worth making to any trust with a net zero commitment in its annual report. A capital route the trust controls, such as pooled devolved formula capital, leaves the trust owning the array and counting the generation against its own emissions. A route where a third party owns the equipment does not, or not straightforwardly, and a trust that has told its members it is working towards net zero should settle that question before it signs rather than after.

WATCH FOR
A capital route that suits a trust but not a maintained school, or the reverse

When battery storage earns its place on a school site

A battery is a storage system that holds generation the site cannot use at the moment it is produced and releases it later, and on a school it does more work than on almost any other building type. Battery storage converts exported electricity into on-site electricity, which raises the value of every kWh the solar panels make.

A BATTERY EARNS ITS PLACE WHEN
  • Heating and ventilation plant starts well before the array does on a winter morning
  • After school clubs, evening lettings or community sports bookings run on into the dark
  • The export limit the network operator agreed is lower than the roof can produce
  • A pool, a kitchen or a server room holds a base load outside the teaching day
IT ADDS COST WITHOUT SAVING WHEN
  • It is offered as the answer to the summer holidays, which a battery cannot store
  • The site already consumes nearly everything the roof makes across the teaching day
  • The same capital would fund lighting, controls and heating time clocks, which on most school estates pay back faster

The school day is the reason. Heating and ventilation come on before the array does, the teaching day ends in the middle of the afternoon while generation continues, and after school clubs, evening lettings and a caretaker's site run all draw power in hours the roof does not cover. A battery shifts the middle of the day into both ends of it.

It is not a fix for the summer holidays, and anyone presenting it as one is overselling. A battery stores a day, not a season, so six weeks of empty buildings in the highest yield months stay six weeks of export whatever is installed. The honest case for storage on a school is the daily shape and a restrictive export limit, not August. We size any battery against twelve months of half hourly data rather than a rule of thumb.

What solar for education buildings costs, and how a school accounts for it

The cost of a school solar system is set by the array size, the roof it lands on and the grid work the connection needs, and the payback is the electricity the school stops buying, valued at the rate it would otherwise have paid, set against that cost. On an education building the second half of that sentence is where the care goes, because the self-consumption share is lower than a generic model assumes.

Cost for every kWp falls as the array grows, because access, design, the grid application and commissioning are largely fixed and spread across more panels. Roof condition is the variable that moves a school quotation most: a sound 1990s sports hall roof and a 1970s teaching block needing structural assessment before anything is fixed to it are two different projects at the same kWp. We ask our partner to break a quotation into those lines so a business manager can see which is which. We do not publish a price per kWp, because a figure given without seeing the buildings is a guess, and a governing body should not be asked to approve a guess.

The tax position is where school advice most often goes wrong, because it gets copied across from commercial property. Capital allowances, the special rate pool and full expensing are reliefs against corporation tax on trading profits, and most schools are not paying corporation tax on trading profits at all. An academy trust is an exempt charity and a maintained school is part of its local authority, so the allowances a trading company would claim on an array are simply not in play. Do not let a proposal show them in the model.

VAT is the relief that does apply, and it works differently by school type. An academy trust recovers VAT on its non-business activity through the refund scheme in section 33B of the Value Added Tax Act 1994, and a maintained school recovers through its local authority under section 33. Where a site is let commercially, part of the recovery can be restricted, which is worth checking with the trust's own advisers before a holiday letting argument is used to justify the scheme. Our cost page sets out what each of these does to a real quotation.

SOURCE
s33B
Value Added Tax Act 1994, the refund scheme for academies

Procurement, governors and spending public money well

A school spends public money under procurement rules and reports the decision to a governing body or a trust board, which makes the evidence behind a solar scheme as important as the scheme itself. This is the part of the public sector process that has no equivalent in private property, and it is the part suppliers most often ignore.

Three practical consequences follow. Quotations have to be comparable, which means they have to be priced against the same scope, which in turn means somebody has to have surveyed the roof before any of them were written. A long contract such as a power purchase agreement is a commitment the school's next business manager inherits, so it belongs in front of whoever reviews the school's other long term liabilities rather than being signed off as an energy decision. And the case put to governors needs to show the self-consumption assumption in the open, because that is the assumption the whole saving rests on and the one a generic model gets wrong on a school.

Our survey pack exists for that reason as much as for the engineering. It gives a business manager one set of measured facts about the estate that every bidder prices against, and it is the school's property whoever wins the work. Where a trust runs its own framework or the local authority has a route already in place, that route usually beats going alone, and we will say so.

One last point on how a case is written up. The strongest paper we see for solar for schools puts the self-consumption share, its source and its weakest assumption on the first page, states the savings as a range rather than a single number, and says what would have to be true for the low end to happen. Governors approve that paper quickly because it does not ask them to take anything on trust. A paper that leads with a headline saving and buries the modelling improves nobody's position, least of all the business manager who has to defend it in three years.

WATCH FOR
A single quotation presented to governors as a comparison

What an array gives the pupils, beyond the electricity

A rooftop array gives a school a working piece of energy infrastructure that pupils can see, measure and argue about, which is a genuine benefit and also the one most often inflated in a sales document. It is worth having and it is not worth paying a premium for.

The practical version is modest and real. Most inverters publish generation data, a display in a public part of the building makes it visible, and the underlying figures support work in science, geography, mathematics and design across primary and secondary. A primary school can use the daily curve directly; a sixth form or college can work with the raw half hourly export. Either way, ask for the monitoring and the data feed to be specified at design stage, because retrofitting a display and an export of the data afterwards costs more than including it.

The wider case is about the estate rather than the curriculum. A school that generates part of its own power reduces the emissions attributed to its electricity, which matters to trusts reporting against a net zero commitment and to local authorities reporting net zero progress across their own estate. Clean energy generated on the roof is the part of a school's net zero position that is genuinely within its control, unlike the grid it buys the rest from. That is a real outcome, it is measurable, and it sits alongside the savings rather than instead of them.

IN PRACTICE
A live generation display in reception, and the data behind it in the classroom

The installation process, from survey to commissioning

Installation is a fixed sequence that runs from survey through to commissioning, and on a school it is governed by safeguarding, by access and by the calendar rather than by how long the panels take to fix down. Rooftop solar on a school building in England is usually permitted development, so planning is rarely the item that sets the date.

FIG. 6 The sequence, and where it waits
01
survey
02
design and layout
03
G99 application
04
install
05
commission and certify
enquiry first generation

The connection is the long pole, which is why we submit it early rather than after a contract is signed. Anything above 3.68 kW per phase runs under G99, and the network operator sets the export limit.

Work starts with the survey and the design, then the grid application, because anything above the smaller threshold connects under G99 rather than by G98 notification and the network operator sets the export limit. Then access, mounting, the modules, the DC and AC electrical work and the tie in to the board. Then commissioning, testing, the MCS certificate and handover of the operation and maintenance file. Our partner installs to that sequence on every site, and where a block has to be surveyed structurally first, the design waits for the engineer rather than the other way round.

The summer holidays are the window, and that is the one scheduling fact every school already knows. Six weeks with the buildings empty is enough to install most rooftop arrays, it removes the safeguarding complication of contractors moving through an occupied site, and it means scaffold and a mobile platform can stand where they need to. The consequence is that the grid application has to go in early in the spring, because the connection is the long pole and a school that starts the conversation in June has usually lost that year's window. School and college installations therefore cluster in August, which is also when installers are busiest, so an early decision buys a better programme as well as a better price.

Maintenance afterwards is light: an annual inspection, a check on the inverters and clearing anything that has grown up to shade the array. An annual energy review is worth running alongside it, because a change in how the site is used through the holidays changes the self-consumption share the whole case was built on. Inverters carry the shortest working life in the system, so plan on replacing them once inside the array's life and treat it as a maintenance cost rather than a surprise.

Tell us about the buildings

Send the postcode, roughly when each block was built and what the site is used for outside term. We come back with what the roofs can carry, what an array would generate against your own consumption term by term, and what the funding routes look like on those numbers.

No survey fee, no obligation. Lenzie Consulting Ltd arranges the survey and passes your details to our MCS-certified installation partner so they can quote.

We pass your details to our MCS-certified installation partner so they can quote. Read the privacy notice.

Questions business managers ask before a survey

Can schools get free solar panels?
Free solar panels for schools usually means one of three things. A grant programme, where public money buys the equipment and the school keeps the electricity: as at 16 July 2026, 245 schools and colleges had government funded solar under the Great British Energy Solar Partnership, with 100 more announced backed by up to £40 million (gov.uk). Where a school is in that programme the panels genuinely are free to it. A power purchase agreement, where a third party owns the array and sells the school the electricity for fifteen to twenty five years: no capital is paid, but the cheapest power on the site is committed for the term. Or a community energy society, which raises the capital locally and shares the benefit. Only the first is free in the ordinary sense, and a supplier using the word about the second is describing a contract, not a gift. Note also that the Partnership has no application route. Schools are selected and contacted, primarily in areas of deprivation in the North East, West Midlands and North West, with at least ten in each region of England, and no government page publishes a form, a portal or a closing date. If somebody offers to help with the application, ask which gov.uk page it is on.
How much money do schools save with solar panels?
We do not publish a savings figure of our own, because the honest answer depends on a number a generic model gets wrong on schools. Government has published estimates and they are worth reading carefully rather than quoting. The Department for Education estimates that on average a typical school could save up to £25,000 a year with solar panels and complementary technologies installed such as batteries (Education Estates Strategy, 16 February 2026), a figure conditional on storage. And on 16 July 2026 government reported that secondary schools which have had solar panels installed and their lights upgraded to LED lighting are saving £58,600 a year, and primaries £21,000 (gov.uk). That second figure is for solar plus a lighting upgrade, not for solar alone, and anyone quoting it as a solar saving has dropped half the sentence. The saving from an array is the electricity the site uses from it, valued at the rate it would otherwise pay, plus a much smaller export payment for the rest. Modelled against a 190 day school year, only 49 percent of a school roof's annual output lands while the building is open, against 71 percent for an organisation that works every weekday (EU PVGIS v5.2, SARAH3), and the teaching day ends mid afternoon while the roof is still producing. A school with a pool, a commercial kitchen, holiday lettings or a battery consumes far more of what it makes than one without. The survey measures the split from half hourly meter data across twelve months, and that measured share is what any saving should be calculated from.
What is the 20 percent rule for solar panels?
The 20 percent rule is a phrase that circulates online rather than a rule in UK planning law, the building regulations or the grid codes. Nothing in any of them sets a 20 percent threshold. What actually constrains an array on a school is the structural capacity of the roof once an engineer has checked it, which on a building of a certain age means establishing the RAAC and asbestos position first, the usable area left after plant, rooflights, walkways and shading come out, the export limit the distribution network operator will agree under G98 or G99, and the school's own consumption during daylight hours. Each of those is measured, and none is a fixed percentage of anything.
What is the best energy source for a school?
There is no single best energy source for a school, and the useful question is which measure a particular site should spend its next pound of capital on. Reducing demand normally beats generating: lighting, controls, insulation and getting the heating to stop running into an empty building in August deliver more per pound on most school estates than any generation does. Rooftop solar is the strongest generation option for a school because the roof area already exists and nothing needs planning permission in most cases, but its value is limited by the calendar in a way it is not on a building that works all summer. Heat is the harder problem and it is a separate project, usually a heat pump one. A school looking at solar in isolation is answering a smaller question than the one its estate actually poses.
Do school roofs with RAAC need different treatment?
Yes, and the treatment is that an array is not designed onto that roof until a competent structural engineer has assessed it. Reinforced autoclaved aerated concrete may be present in the floors, walls and roofs of buildings constructed or modified between the 1950s and 1990 (DfE identification guidance, 14 December 2022, updated 20 July 2026), and the Health and Safety Executive describes it as less durable than traditional concrete, advising dutyholders to seek a competent structural engineer to assess it and develop a management plan. The Institution of Structural Engineers publishes the investigation and assessment guidance that engineer works to. We will never tell a school that a specific roof is safe or unsafe. We establish which blocks fall in the window, record what the responsible body already holds, and put the structural question in front of somebody qualified to answer it before anything is designed.
Does a school need planning permission for solar panels?
Rooftop solar on a school building in England is usually permitted development under Schedule 2, Part 14 of the Town and Country Planning (General Permitted Development) (England) Order 2015, subject to the limits and conditions that Part sets out, including how far panels may project above the roof plane and prior approval in certain cases. That is not the same as needing nothing. Listed buildings, conservation areas, National Parks and other designated land change the answer, as do planning conditions restricting roof alterations, and Scotland, Wales and Northern Ireland have their own orders. We confirm the position with the local planning authority before the design is fixed rather than after.
Can an academy trust claim capital allowances on solar panels?
In almost all cases no, and it is the most common error in a proposal written for a school by somebody used to commercial property. Capital allowances, the special rate pool and full expensing are reliefs against corporation tax on trading profits. An academy trust is an exempt charity and a maintained school is part of its local authority, so neither is paying corporation tax on trading profits for those reliefs to reduce. The relief that does apply is VAT: an academy trust recovers VAT on non-business activity under the refund scheme in section 33B of the Value Added Tax Act 1994, and a maintained school recovers through its local authority under section 33. Where a site is let commercially, recovery can be restricted. The trust's own advisers confirm the position.
Is a power purchase agreement a good deal for a school?
It depends on the load under the roof and on the length of the term, and it is a legal question as much as an energy one. A PPA suits a school with a strong daytime base load, no capital available and a covering with decades of life left in it, because the school pays nothing up front and buys power below its current rate. It suits a school poorly where the load is light through the holidays, because the electricity committed is the electricity the school was going to use anyway at its cheapest. Read what the contract says about roof access and repairs, about the position on academy conversion or a change of responsible body, about indexation of the unit price, and about what happens at the end of the term. It is a fifteen to twenty five year commitment the next business manager inherits.
Who installs the system, and what does your role cover?
Installation is carried out by our MCS-certified partner, who holds the contract with the school and issues the certificate. We arrange the survey, the array design, the grid application, the funding comparison and the paperwork in between. We are not the installer, we do not hold MCS certification ourselves, and we say so plainly because the distinction matters to a business manager working out who is responsible for what and to a governing body recording who it has contracted with.