Specialist solar panels for schools in Buxton
A kilowatt-peak on a Buxton school roof models at 805 kWh a year, below the mean across the towns we cover, and the roofs it applies to are mostly carrying nothing. The survey records sheet type, remaining life, purlin spacing and the state of the incoming supply, and the model runs off your own meter data rather than an average.
26.3% of the modelled year lands in July and August, on a roof that returns 805 kWh per kWp a year. The worked example below runs at 200 kWp, the size applied for at the nearest school scheme on record. Source: EU PVGIS v5.2, SARAH3, 10 degree pitch, 14 percent system loss.
Book a roof survey in Buxton- 1 teaching block
- 2 hall and kitchen
- 3 sports hall
- 4 1960s block, no array
- first phase
- later phase
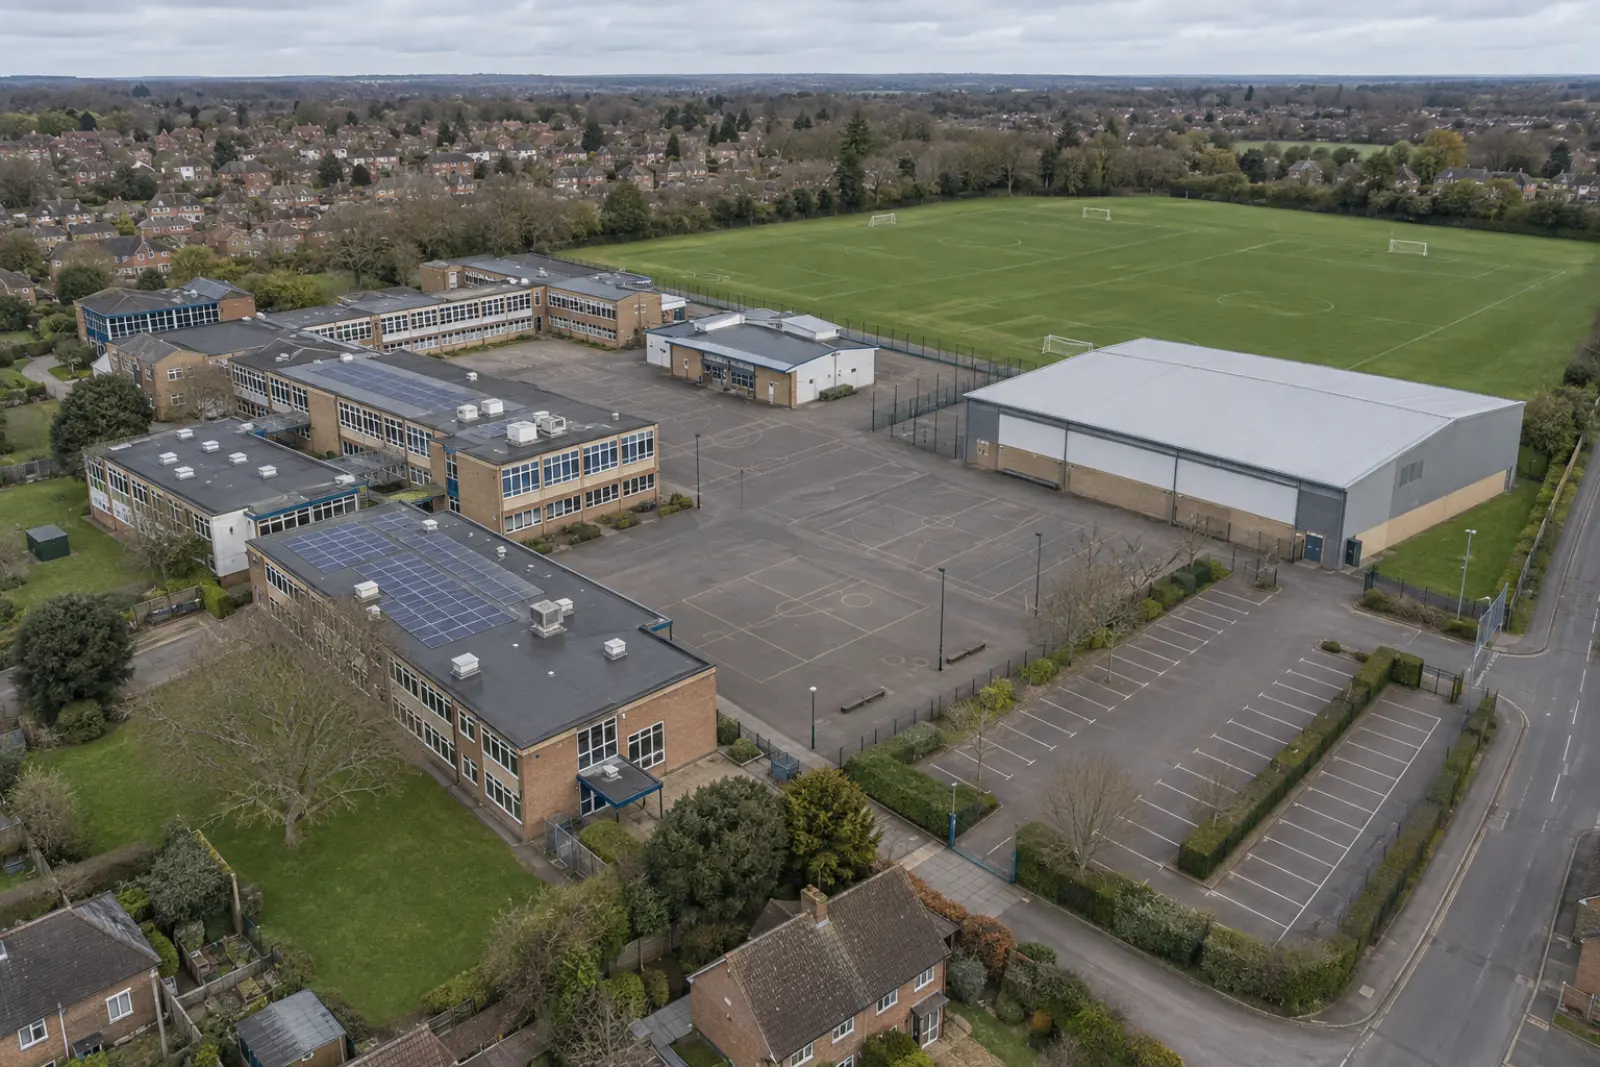
Illustrative layout for an estate of this size. The array is drawn at about 345 kWp, roughly 53 percent of the 650 kWp these three roofs would hold, because a school sizes to the load it can use in term time rather than to the roof it has: generation it cannot use is exported at a much lower rate than it pays to import. The hatched block carries no array because its structure has not been assessed, which on a school of that era is the usual starting point rather than an exception. Your own figures, and which of your blocks can take an array, come from the roof survey.
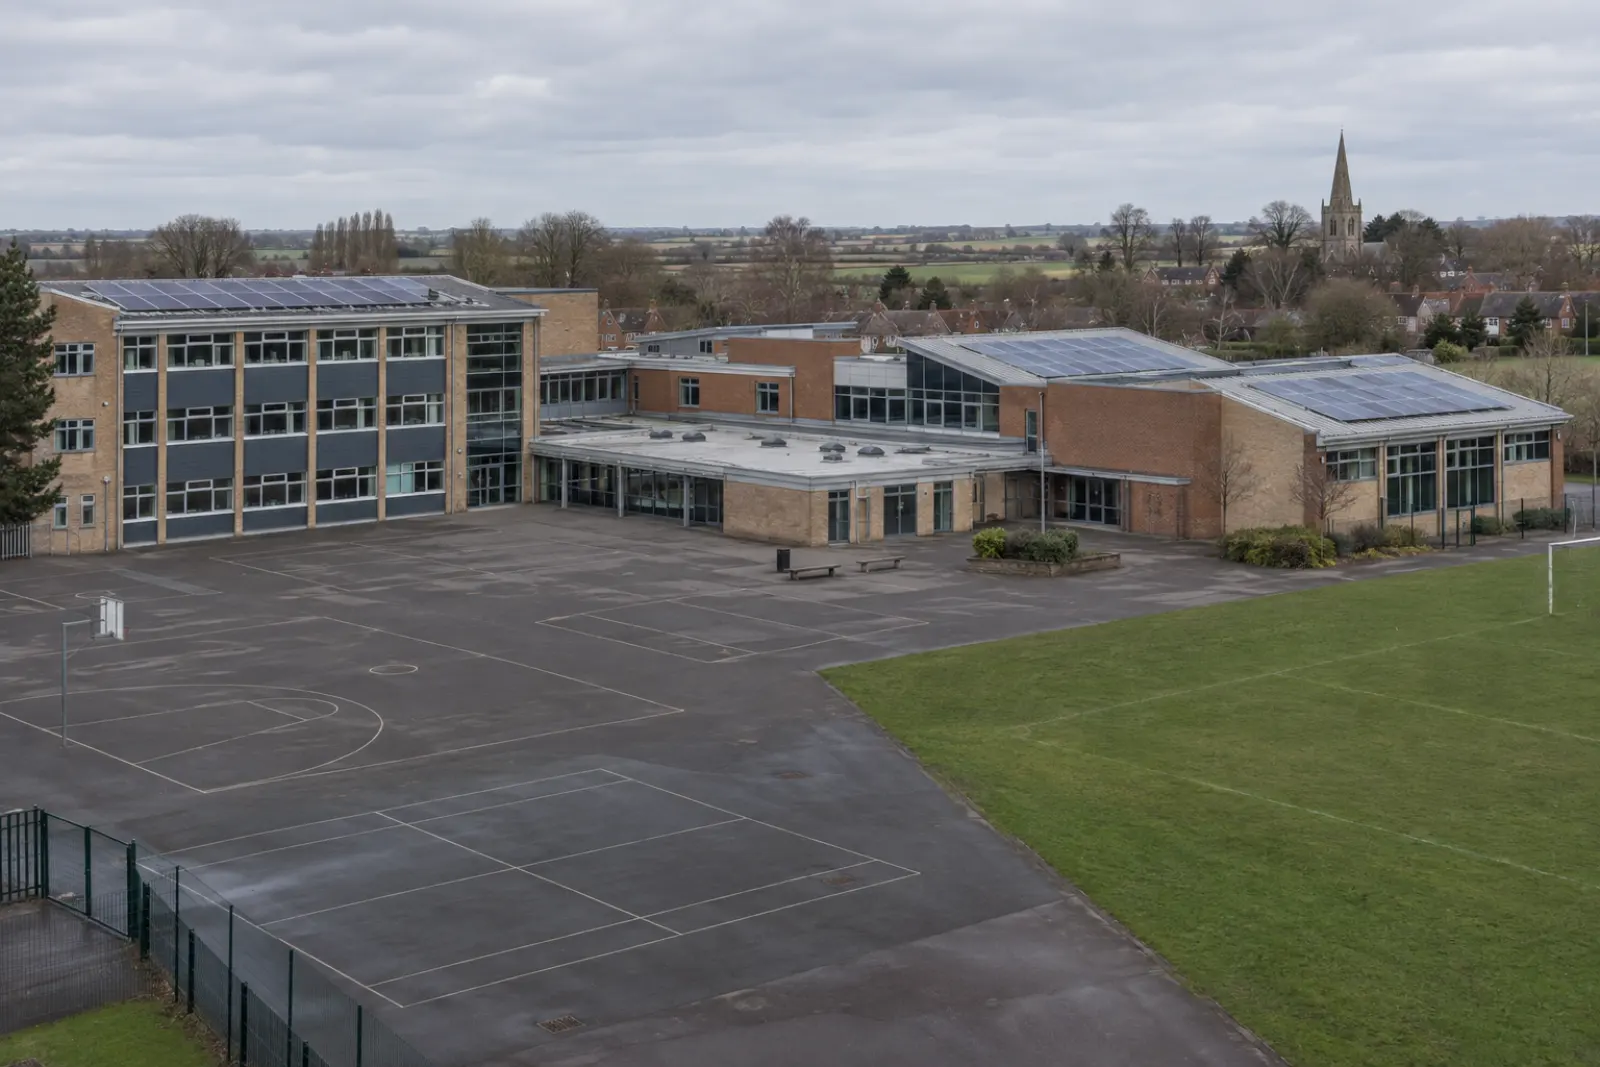
Solar PV for academy trusts across Derbyshire
A one kilowatt-peak array on a shallow pitched roof in Buxton models at 805 kWh a year, from modelled irradiation of 1,025 kWh per square metre in the plane of the array (EU PVGIS v5.2, SARAH3, 10 degree pitch, 14 percent system loss). That is about 9 percent below the mean across the towns we cover, so the case at this latitude rests almost entirely on using the output on site rather than exporting it.
Scaled up, a 200 kWp array, sized to what the nearest school scheme on record applied for, 17 miles away at Matlock, models at about 161,000 kWh a year before shading, and needs roughly 594 square metres of clear roof. We take the size from the nearest real application rather than a round number, so the example is anchored to something a planning officer has already seen.
Spread across the year that is about 42,300 kWh landing in July and August and roughly 6,400 kWh across December and January. National Grid Electricity Distribution sets what may go back onto the network here, so the July figure is the one worth putting in front of a governing body first.
Buxton ranks 8 of 8 towns we cover in Derbyshire on modelled yield, against a national mean of 886 kWh per kWp. The county runs from 805 to 866, a spread of 61 kWh per kWp. On a 500 kWp array that is about 30,500 kWh a year between the strongest and weakest town in the county.
The planning position for Buxton schools
No school or college solar scheme appears in the SK17 postcode district in the Renewable Energy Planning Database. That is a reporting threshold rather than a verdict. The database records generating stations from one megawatt upward reliably and smaller ones patchily, and almost every school array is a fraction of that, so a roof full of panels on a Buxton secondary could be generating today without ever reaching it.
The closest recorded one is about 17 miles away at Matlock: Anthony Gell School, Wood Street, a 200 kWp roof mounted array applied for by Private Developer, which is with the planning authority. We were not involved in it. We cite it because it is a public record of what has cleared planning in this part of Derbyshire. Source: Renewable Energy Planning Database, Q1 2026.
Why demand in Buxton falls as the roof peaks
The generating year and the school year are out of step in Buxton. July and August carry 26.3 percent of the modelled output (EU PVGIS v5.2), and the site is closed for most of those nine weeks. May is the strongest single month here at 14.1 percent of the annual total, which is still term time, and that works slightly in your favour against towns whose curve peaks in July.
At the other end of the year the mismatch flips. Only 4 percent of output falls in December and January, the two months when a Buxton school is fully occupied and its heating and lighting are at their heaviest. The roof makes 7.6 times as much in May as it does in December, and August alone outproduces December by about 6.5 to one. 76 percent of the year arrives between April and September, and the point of that figure is not that the summer half goes unused, because April, May and June are full teaching months that draw hard. It is that the concentration peaks in the few weeks at the end of it when the building is shut.
Summed over the year, about 49 percent of what a school roof makes arrives while the school is open. For a business trading every weekday the equivalent is roughly 71 percent. Nothing about Buxton changes that ratio much, but plenty about your own site changes what to do with it.
Then there is the afternoon. From roughly three o'clock the building empties while the roof is still working, so a system sized on annual consumption will over-generate in exactly the hours nobody is there. We size on half hourly data for that reason.
A Buxton governing body should read that as a sizing constraint, not a reason to stop. The base load that runs through the holidays, servers, comms, refrigeration, ventilation and hot water, is the floor the array should be built up from, and everything above it has to be justified by storage, export or summer occupancy.
We set out the full treatment of the school year against the generation curve on the home page, and what it does to a payback figure under costs.
- generated while the school is open
- generated at a weekend or in the holidays
The same figures as a table
| Month | Session days | Output, kWh per kWp | School open | School closed |
|---|---|---|---|---|
| Jan | 20 | 17 | 11 | 6 |
| Feb | 15 | 32 | 17 | 15 |
| Mar | 21 | 65 | 44 | 21 |
| Apr | 12 | 97 | 39 | 58 |
| May | 17 | 114 | 63 | 51 |
| Jun | 21 | 113 | 79 | 34 |
| Jul | 11 | 114 | 40 | 74 |
| Aug | 0 | 98 | 0 | 98 |
| Sep | 20 | 74 | 49 | 25 |
| Oct | 17 | 43 | 24 | 19 |
| Nov | 21 | 24 | 17 | 7 |
| Dec | 15 | 15 | 7 | 8 |
| Year | 190 | 806 | 390 | 416 |
The school estate in High Peak
High Peak has 54 open state-funded schools and colleges on the DfE register teaching 10,735 pupils between them. Source: DfE Get Information About Schools.
The split is 46 primary, 7 secondary and 1 special, at an average of 199 pupils a site. Read 6.6 primaries per secondary as a sequencing hint rather than a statistic. A primary is a single survey visit and a modest array; a secondary is several roofs of different ages on one site, and that is where both the area and the complications are.
A trust holding more than one of these sites should look at them together. Grouping the surveys turns the grid question, the funding question and the procurement route into one exercise rather than four, and it usually changes which roof goes first.
Grid connection through National Grid Electricity Distribution
National Grid Electricity Distribution operates the distribution network across Derbyshire, so the export application goes to them. Anything larger than 3.68 kW per phase falls under G99, which means an application before commissioning rather than a notification afterwards. A constrained network is not the end of a scheme. Capping export costs little when the building already absorbs most of what the roof produces.
Across Derbyshire the planning database records 144 solar schemes totalling 904 MW, of which 27 are operational (REPD Q1 2026).
Send us the school postcode
We survey school and college roofs throughout Derbyshire. We need the postcode, a rough roof area and your half hourly meter data if the trust has it. From that we model what the roof carries, what it generates against the timetable, and which of the funding routes actually suits a school of your size.
Lenzie Consulting Ltd arranges the survey and passes your details to an MCS-certified installation partner so they can quote. We do not carry out the installation ourselves.
What Buxton trusts ask before a survey
- How much would a school roof near Buxton generate?
- Modelled at 805 kWh per kWp a year, a 200 kWp array on a Buxton school models at about 161,000 kWh. What decides whether that is worth doing is how much of it the school uses itself, not the total. Source: EU PVGIS v5.2, SARAH3, 10 degree pitch, 14 percent system loss.
- How does the school year affect a solar scheme in Buxton?
- It goes somewhere, just not into the timetable. 26.3 percent of the Buxton generating year lands in July and August (EU PVGIS v5.2), and a closed school still runs servers, comms, refrigeration and ventilation. What that base load does not absorb is either stored, exported under an agreement with National Grid Electricity Distribution, or a sign the array is too big. We test which before sizing anything.
- Which network operator handles the connection at a Buxton school?
- Applications go to National Grid Electricity Distribution, who run the network across Derbyshire. An export-limited offer usually still works for a school, because the summer surplus is the part you were least likely to be paid much for anyway.
- What does High Peak require for solar on a school building?
- Roof-mounted solar on a non-domestic building often falls within permitted development under Part 14 of the General Permitted Development Order, subject to limits on how far the panels stand proud of the roof plane and, above a threshold, to prior approval from High Peak on siting and design. Listed buildings and conservation areas are the usual exceptions. We put the position to High Peak before a design is finalised.
- How many schools are there around Buxton?
- High Peak has 54 open state-funded schools and colleges on the DfE register, with 10,735 pupils on roll. Source: DfE Get Information About Schools. We survey across the whole of that area, and where a trust holds several sites we look at them in one pass.