Specialist solar panels for schools in Marylebone
A school roof in Marylebone makes 5.6 times as much in June as it does in December, and the school year runs against that curve rather than with it. What we come back with is the usable roof area, the modelled output against your meter data, and the routes schools use to pay for it.
153,300 kWh a year, modelled for a 170 kWp array on roughly 505 sqm of clear roof. That is the size applied for at the nearest school scheme on record. Source: EU PVGIS v5.2, SARAH3, 10 degree pitch, 14 percent system loss.
Book a roof survey in Marylebone- 1 teaching block
- 2 hall and kitchen
- 3 sports hall
- 4 1960s block, no array
- first phase
- later phase
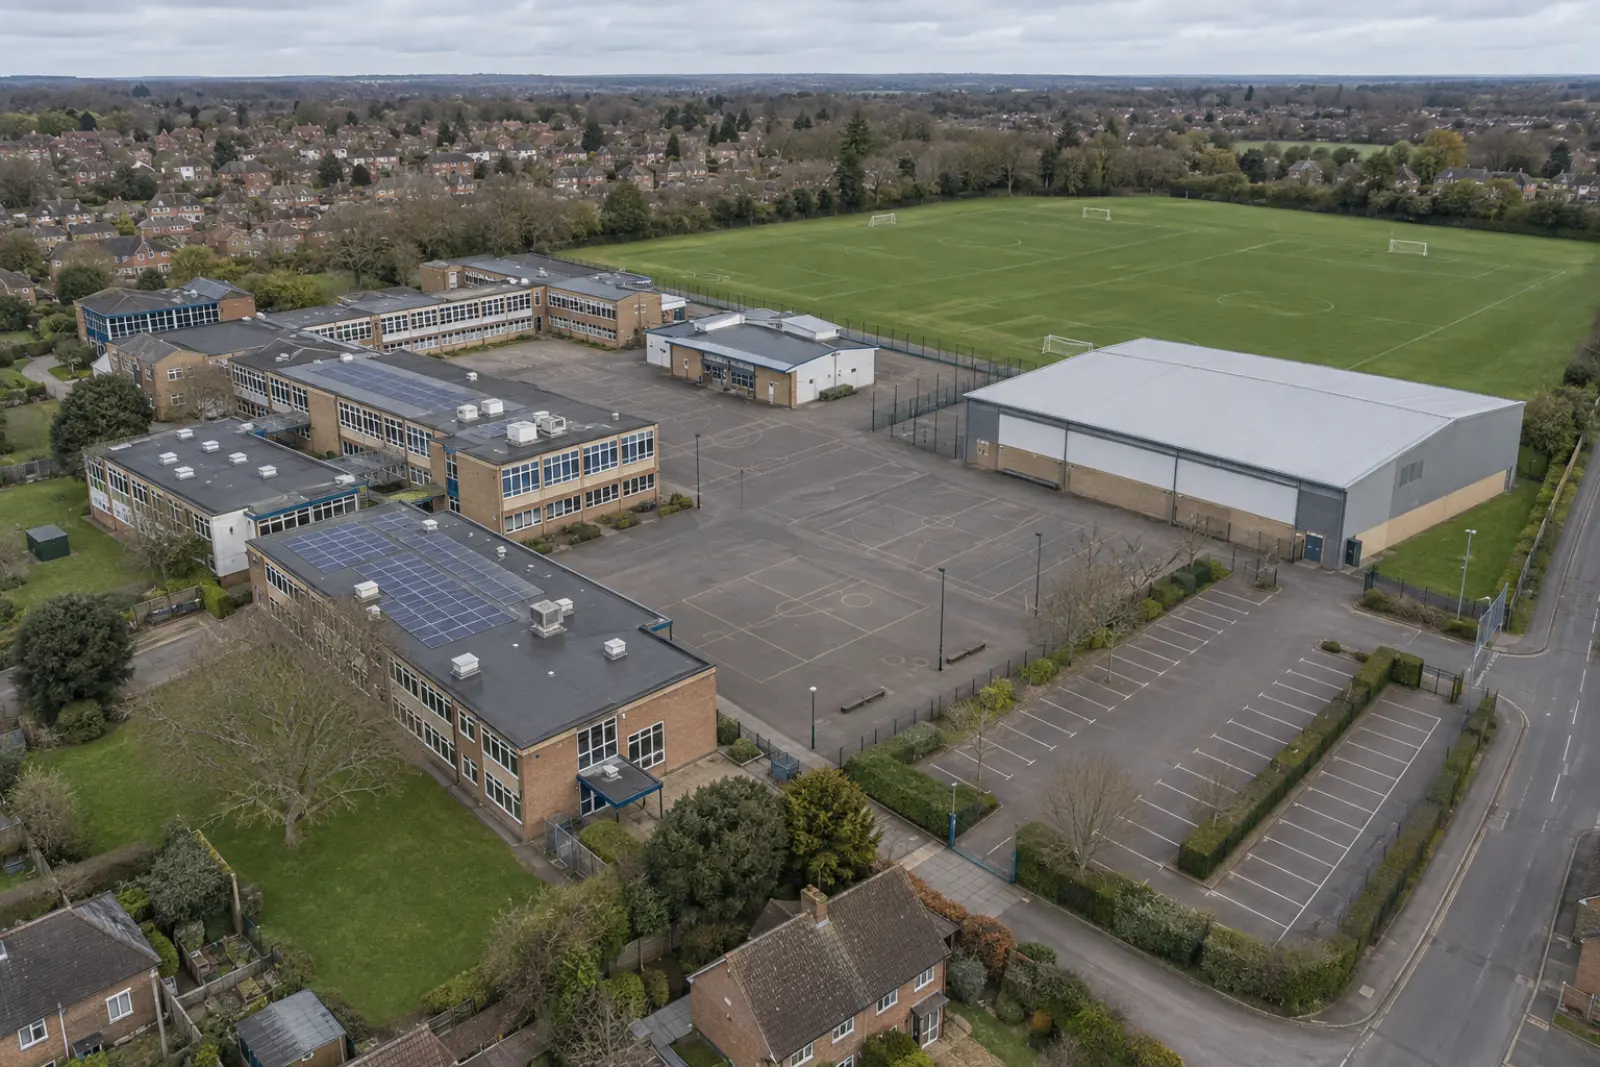
Illustrative layout for an estate of this size. The array is drawn at about 345 kWp, roughly 53 percent of the 650 kWp these three roofs would hold, because a school sizes to the load it can use in term time rather than to the roof it has: generation it cannot use is exported at a much lower rate than it pays to import. The hatched block carries no array because its structure has not been assessed, which on a school of that era is the usual starting point rather than an exception. Your own figures, and which of your blocks can take an array, come from the roof survey.
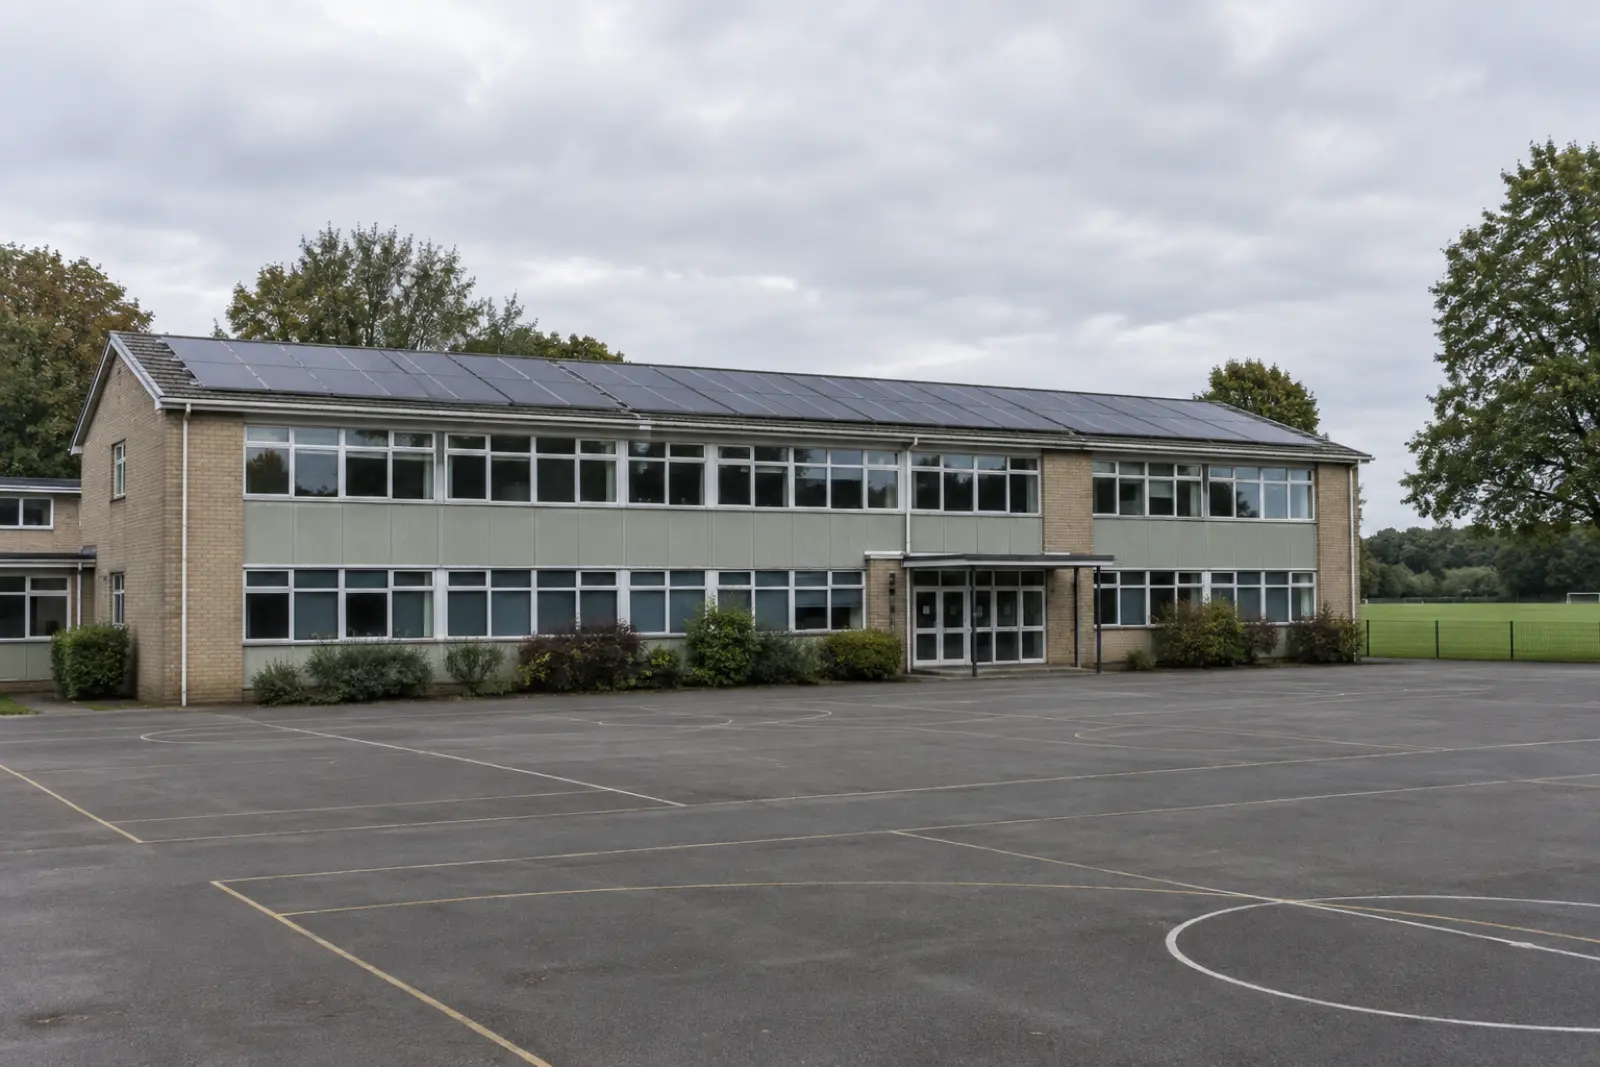
School rooftop solar across Greater London
A one kilowatt-peak array on a shallow pitched roof in Marylebone models at 902 kWh a year, from modelled irradiation of 1,160 kWh per square metre in the plane of the array (EU PVGIS v5.2, SARAH3, 10 degree pitch, 14 percent system loss). That is roughly 2 percent above the mean across the towns we cover, so latitude is working slightly in your favour here.
Scaled up, a 170 kWp array, sized to what the nearest school scheme on record applied for, 18 miles away at St Albans, models at about 153,300 kWh a year before shading, and needs roughly 505 square metres of clear roof. We take the size from the nearest real application rather than a round number, so the example is anchored to something a planning officer has already seen.
Spread across the year that is about 38,900 kWh landing in July and August and roughly 8,100 kWh across December and January. UK Power Networks sets what may go back onto the network here, so the July figure is the one worth putting in front of a governing body first.
Marylebone ranks 37 of 50 towns we cover in Greater London on modelled yield, against a national mean of 886 kWh per kWp. The county runs from 847 to 987, a spread of 140 kWh per kWp. On a 500 kWp array that is about 70,000 kWh a year between the strongest and weakest town in the county.
What the planning record shows around Marylebone
The Renewable Energy Planning Database holds no school scheme for Marylebone and the area around it. Read that as a gap in the record, not a gap in the roofs: the database is reliable above one megawatt and thin below it, and a school array is typically a fifth of a megawatt.
The nearest education scheme on the record is 18 miles from Marylebone, at St Albans: 200 kWp at Samuel Ryder Academy, applicant Scholars Education Trust, which was withdrawn before determination. That is someone else's application, not ours, and it is here because it shows what Hertfordshire planning has already accepted at an education site. Source: Renewable Energy Planning Database, Q1 2026.
The summer holiday problem for a Marylebone school
25.4 percent of the annual output modelled for Marylebone arrives in the two months a school uses least (EU PVGIS v5.2). Term ends in the third week of July and the buildings stay largely empty until September. June is the strongest single month here at 13.7 percent of the annual total, which is still term time, and that works slightly in your favour against towns whose curve peaks in July.
The inverse holds at the other end. December and January together return only 5.3 percent of the year, and those are the months with the heating, the lighting and the full timetable all running at once. The roof makes 5.6 times as much in June as it does in December, and August alone outproduces December by about 4.8 to one. 73 percent of the year arrives between April and September, and the point of that figure is not that the summer half goes unused, because April, May and June are full teaching months that draw hard. It is that the concentration peaks in the few weeks at the end of it when the building is shut.
Summed over the year, about 49 percent of what a school roof makes arrives while the school is open. For a business trading every weekday the equivalent is roughly 71 percent. Nothing about Marylebone changes that ratio much, but plenty about your own site changes what to do with it.
Inside the day it happens again. The roof is still at three quarters of its peak at four in the afternoon, by which time a Marylebone school is largely empty, so the hours that look best on a generation chart are the worst on a consumption one.
A Marylebone governing body should read that as a sizing constraint, not a reason to stop. The base load that runs through the holidays, servers, comms, refrigeration, ventilation and hot water, is the floor the array should be built up from, and everything above it has to be justified by storage, export or summer occupancy.
We set out the whole argument about term dates and the generation curve on the home page, and what it does to a payback figure under costs.
- generated while the school is open
- generated at a weekend or in the holidays
The same figures as a table
| Month | Session days | Output, kWh per kWp | School open | School closed |
|---|---|---|---|---|
| Jan | 20 | 26 | 17 | 9 |
| Feb | 15 | 38 | 20 | 18 |
| Mar | 21 | 73 | 49 | 24 |
| Apr | 12 | 105 | 42 | 63 |
| May | 17 | 119 | 65 | 54 |
| Jun | 21 | 124 | 87 | 37 |
| Jul | 11 | 124 | 44 | 80 |
| Aug | 0 | 105 | 0 | 105 |
| Sep | 20 | 83 | 55 | 28 |
| Oct | 17 | 52 | 29 | 23 |
| Nov | 21 | 31 | 22 | 9 |
| Dec | 15 | 22 | 11 | 11 |
| Year | 190 | 902 | 441 | 461 |
How many schools Westminster has
Westminster has 54 open state-funded schools and colleges on the DfE register teaching 19,058 pupils between them. Source: DfE Get Information About Schools.
The split is 37 primary, 11 secondary, 3 special and 3 further education, at an average of 353 pupils a site. That is 3.4 primaries for every secondary, which is the ratio that matters for a roof: a primary of a few hundred pupils usually offers a hall roof and one teaching block, while a secondary site carries a sports hall, a dining block and several flat roofs.
If your trust holds several of them, the sequencing question comes before the sizing question. Roof age, covering type and the state of the incoming supply vary block by block across an estate, and that is normally what sets the order of works.
Grid connection through UK Power Networks
UK Power Networks operates the distribution network across Greater London, so the export application goes to them. Anything larger than 3.68 kW per phase falls under G99, which means an application before commissioning rather than a notification afterwards. A constrained network is not the end of a scheme. Capping export costs little when the building already absorbs most of what the roof produces.
Start with the Marylebone roof
Lenzie Consulting Ltd arranges roof surveys for schools across Greater London. Send the school postcode and a rough idea of the roof area, and the last twelve months of half hourly meter data if the school holds it. We come back with what the roofs can carry, what they would generate against your own consumption, and the funding routes open to a school.
Lenzie Consulting Ltd arranges the survey and passes your details to an MCS-certified installation partner so they can quote. We do not carry out the installation ourselves.
Questions governors ask us about Marylebone schools
- What would a 170 kWp array produce at a Marylebone school?
- Yes, and the figure matters more than the sunshine. 902 kWh per kWp a year puts a 170 kWp array at around 153,300 kWh, on roughly 505 square metres of roof. The value of that depends on your term time load. Source: EU PVGIS v5.2, SARAH3, 10 degree pitch, 14 percent system loss.
- What happens to the electricity during the summer holidays in Marylebone?
- Less is wasted than governors expect, but the figure is worth seeing: 25.4 percent of the year is modelled to arrive in July and August here (EU PVGIS v5.2), against a site running on holiday base load. Lettings, holiday clubs and summer works take some of it, storage takes more, and the rest is an export question for UK Power Networks.
- Who do we apply to for export near Marylebone?
- Only UK Power Networks can answer it for your connection. What we can say is that a capped export limit rarely breaks a school scheme, because the array that suits a school is sized to the term time load rather than to the roof.
- How many schools are there around Marylebone?
- Westminster has 54 open state-funded schools and colleges on the DfE register, with 19,058 pupils on roll. Source: DfE Get Information About Schools. We survey across the whole of that area, and where a trust holds several sites we look at them in one pass.