Specialist solar panels for schools in Newport City Centre
What decides a solar scheme at a Newport City Centre school is how much of the output the site uses itself, not how much the roof makes. We look at the roof, the switchboard and the timetable in that order, then set the array size against what the site draws in term time.
Book a roof survey in Newport City Centre- 1 teaching block
- 2 hall and kitchen
- 3 sports hall
- 4 1960s block, no array
- first phase
- later phase
Illustrative layout for an estate of this size. The array is drawn at about 345 kWp, roughly 53 percent of the 650 kWp these three roofs would hold, because a school sizes to the load it can use in term time rather than to the roof it has: generation it cannot use is exported at a much lower rate than it pays to import. The hatched block carries no array because its structure has not been assessed, which on a school of that era is the usual starting point rather than an exception. Your own figures, and which of your blocks can take an array, come from the roof survey.
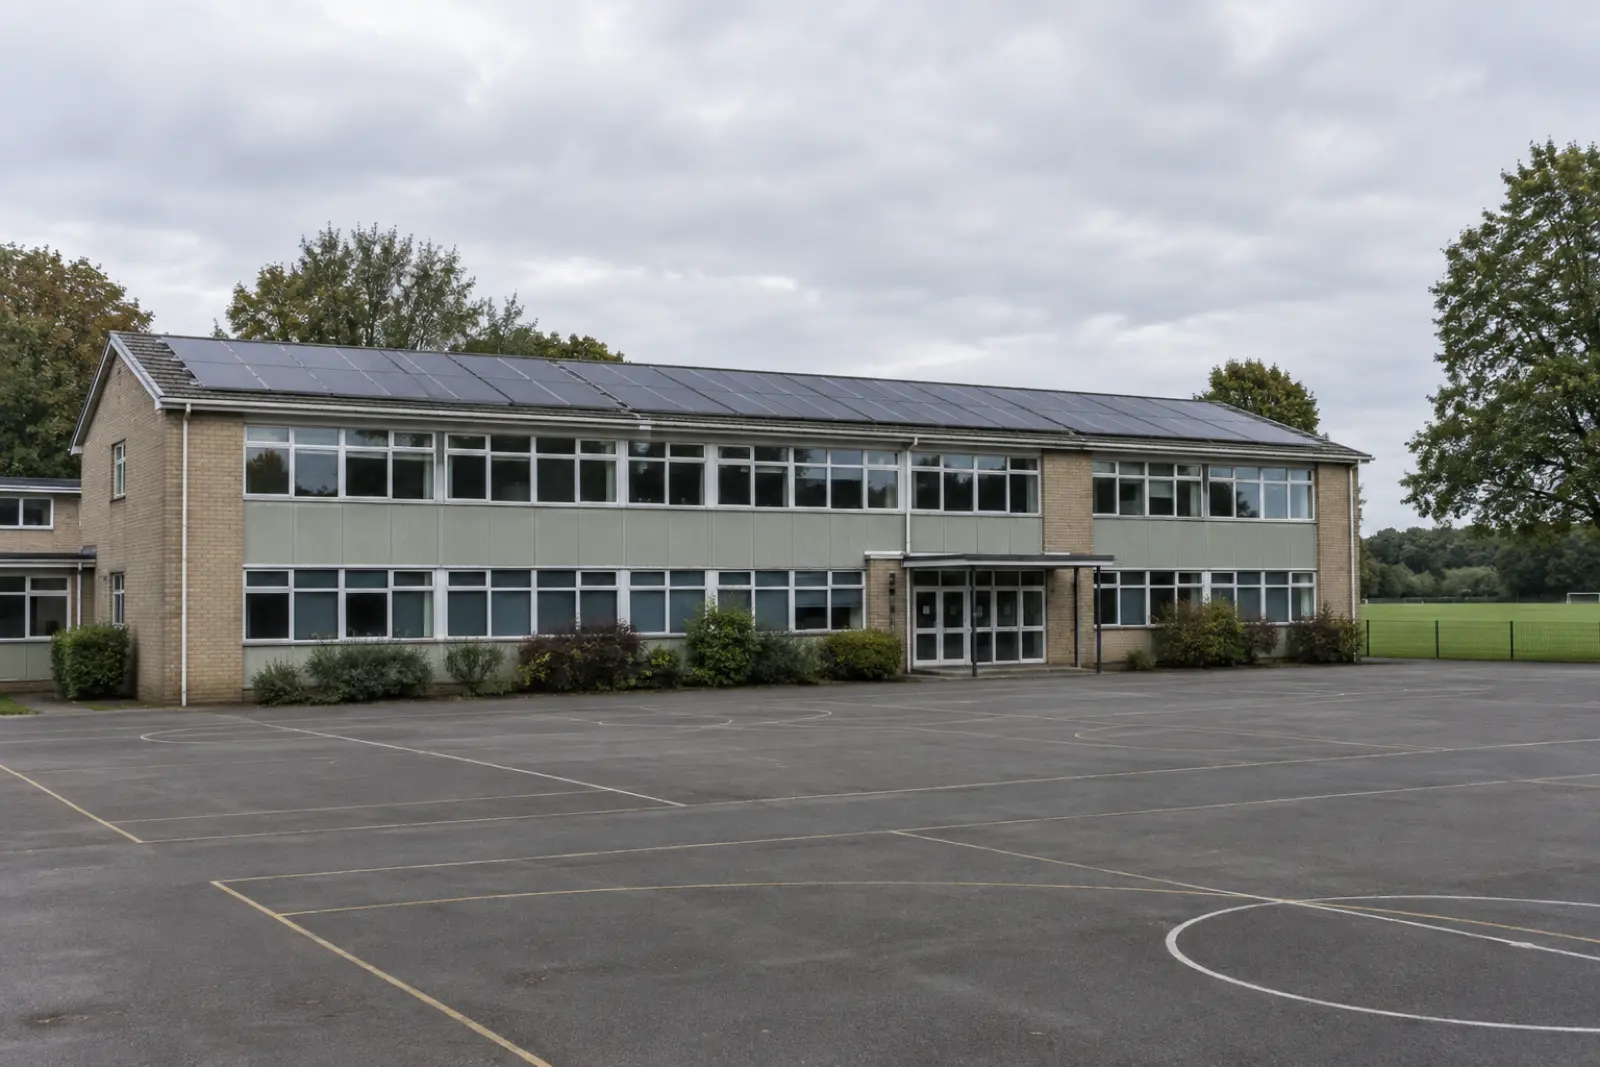
School rooftop solar across Newport
We model output for Newport City Centre from the same source we use everywhere, EU PVGIS v5.2, and where a town has no modelled figure in the dataset we take it from the survey rather than publish an estimate.
Newport City Centre ranks 0 of 4 towns we cover in Newport on modelled yield, against a national mean of 886 kWh per kWp. The county runs from 887 to 910, a spread of 23 kWh per kWp. Within Newport that difference is small enough to ignore: where the building sits is not what decides this scheme, your consumption pattern is.
What the planning record shows around Newport City Centre
The Renewable Energy Planning Database holds no school scheme for Newport City Centre and the area around it. Read that as a gap in the record, not a gap in the roofs: the database is reliable above one megawatt and thin below it, and a school array is typically a fifth of a megawatt.
Start with the Newport City Centre roof
Lenzie Consulting Ltd arranges roof surveys for schools across Newport. Send the school postcode and a rough idea of the roof area, and the last twelve months of half hourly meter data if the school holds it. We come back with what the roofs can carry, what they would generate against your own consumption, and the funding routes open to a school.
Lenzie Consulting Ltd arranges the survey and passes your details to an MCS-certified installation partner so they can quote. We do not carry out the installation ourselves.